Docker Log Aggregation: A Guide with Grafana and Loki Integration
Docker container log aggregation with Grafana and Loki.

Grafana is an open-source software used for analytics and data logging. One of the more common uses for Grafana is visualization, organization, and monitoring of data.
I'm using Grafana and Loki to ingress logging data from both Docker container log output using the docker Loki plugin.
Getting started
One of the quickest methods to get up and running with Grafana and Loki is to run a containerized setup. This tutorial requires that you have a running Docker environment.
A quick docker environment setup
apt-get update
apt-get install curl
curl -fsSL https://get.docker.com -o get-docker.sh
sh get-docker.sh
If this quick setup doesn't fit your environment, check out https://docs.docker.com/engine/install/.
Install the docker driver for Grafana Loki:
docker plugin install grafana/loki-docker-driver:2.9.1 --alias loki --grant-all-permissions

docker plugin enable loki

...
$ docker plugin ls
ID                  NAME         DESCRIPTION           ENABLED
ac720b8fcfdb        loki         Loki Logging Driver   true
...
https://grafana.com/docs/loki/latest/send-data/docker-driver/
This plugin is required on any container host that will be sending container logs from Docker to Loki using the built in docker logging.
Get Grafana and Loki running with docker compose:
Create a directory for your configuration and docker compose file to live in and enter it:
mkdir -p /opt/loki
cd /opt/loki
nano docker-compose.yml
Change your timezone: https://en.wikipedia.org/wiki/List_of_tz_database_time_zones
services:
  loki:
    container_name: loki
    image: grafana/loki:latest
    environment:
      - TZ=America/New_York
    ports:
      - "3100:3100"
    command: -config.file=/etc/loki/local-config.yaml
    volumes:
      - ./loki-config:/etc/loki
      - ./lokistore:/lokistore
  grafana:
    container_name: grafana
    image: grafana/grafana:7.1.1
    environment:
      - TZ=America/New_York
    ports:
      - "3000:3000"
    volumes:
      - ./grafana-config/datasource.yml:/etc/grafana/provisioning/datasources/datasource.yml
      - grafana-storage:/var/lib/grafana
volumes:
  grafana-storage: {}
docker-compose.yml
Create ./grafana-config/datasource.yml
cd /opt/loki
mkdir -p ./grafana-config
cd grafana-config
nano datasource.yml
# config file version
apiVersion: 1
deleteDatasources:
- name: loki
datasources:
- name: loki
type: loki
access: proxy
orgId: 1
url: http://loki:3100
basicAuth: false
isDefault: true
version: 1
editable: falsedatasource.yml
Create ./loki-config/local-config.yaml
cd /opt/loki
mkdir -p ./loki-config
cd ./loki-config
nano local-config.yaml
auth_enabled: false
server:
http_listen_port: 3100
common:
path_prefix: /loki
storage:
filesystem:
chunks_directory: /lokistore/chunks
rules_directory: /lokistore/rules
replication_factor: 1
ring:
kvstore:
store: inmemory
# --- disable splitting to fix "too many outstanding requests"
query_range:
parallelise_shardable_queries: false
# --- compactor to have control over length of data retention
compactor:
working_directory: /lokistore/compactor
compaction_interval: 10m
retention_enabled: true
retention_delete_delay: 2h
retention_delete_worker_count: 150
limits_config:
retention_period: 240h
split_queries_by_interval: 0 # part of disable splitting fix
# -------------------------------------------------------
schema_config:
configs:
- from: 2020-10-24
store: boltdb-shipper
object_store: filesystem
schema: v11
index:
prefix: index_
period: 24h
ruler:
alertmanager_url: http://alertmanager:9093
analytics:
reporting_enabled: false local-config.yaml
Bring your new compose project up:
cd /opt/loki
docker compose up -d
Your output should look as follows:
[+] Running 3/3
 ✔ Network loki_default  Created
 ✔ Container grafana     Started
 ✔ Container loki        Started
Add the logging driver to a container:
If you are adding this logging driver to a container on a host outside of your localhost, be sure to change loki-url IP address to the IP address of the host running Loki and Grafana.
    logging:
      driver: loki
      options:
        loki-url: "http://127.0.0.1:3100/loki/api/v1/push"
        loki-external-labels: job=dockerlogs,owner=docker,environment=development
After adding the logging driver to your container, run "docker compose up -d".
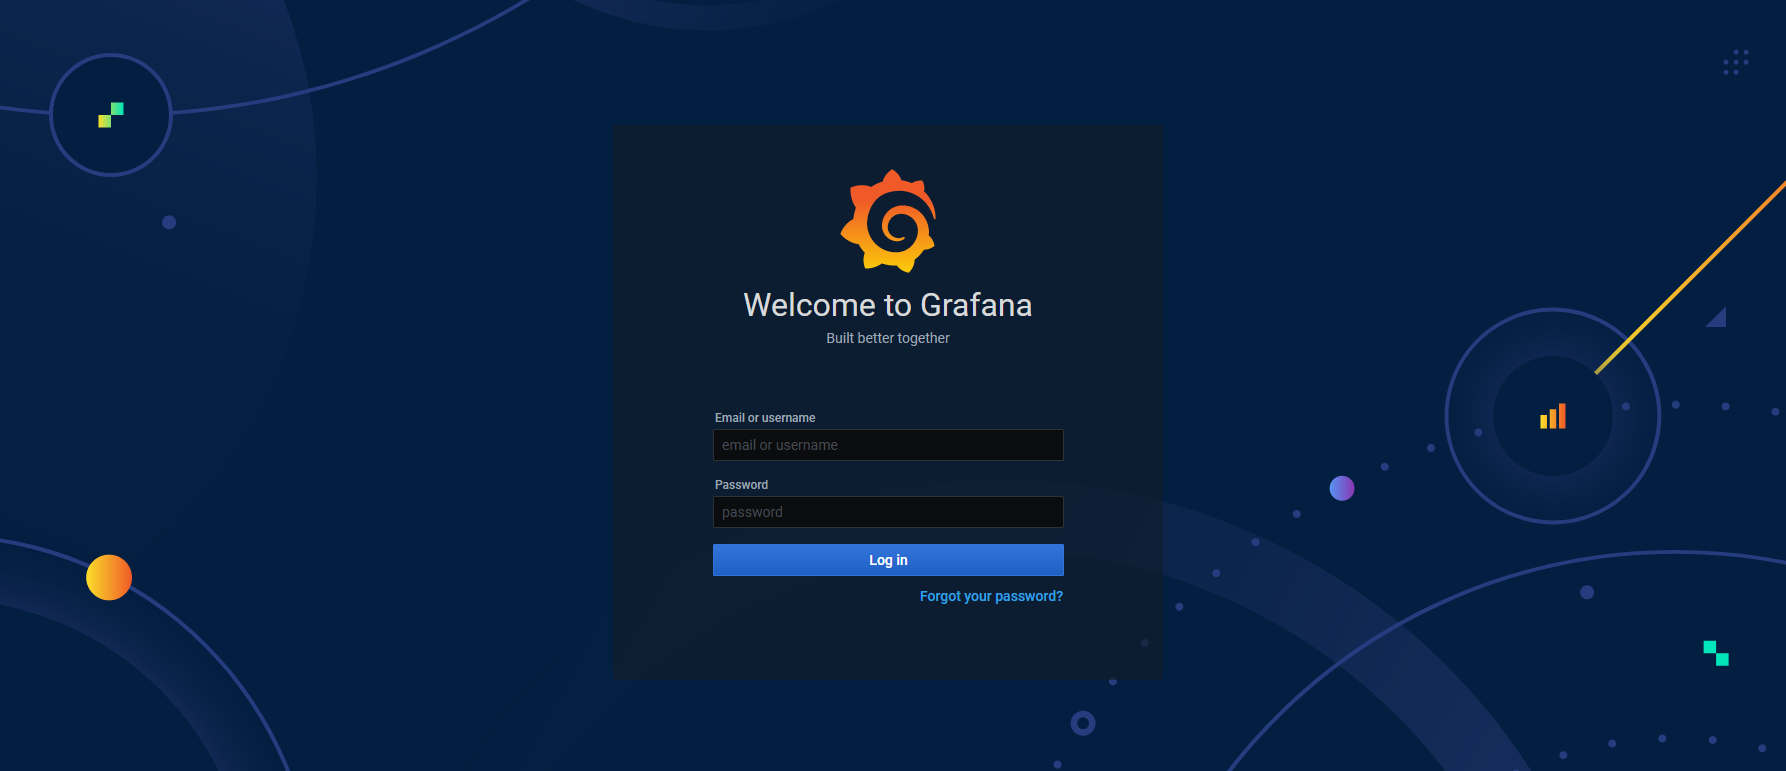
Grafana first-run
Use your favorite browser. Navigate to: http://container-host-ip:3000
Use the Grafana default login: admin/admin.
Set a new password. The storage is set to persist, so your credentials should persist.
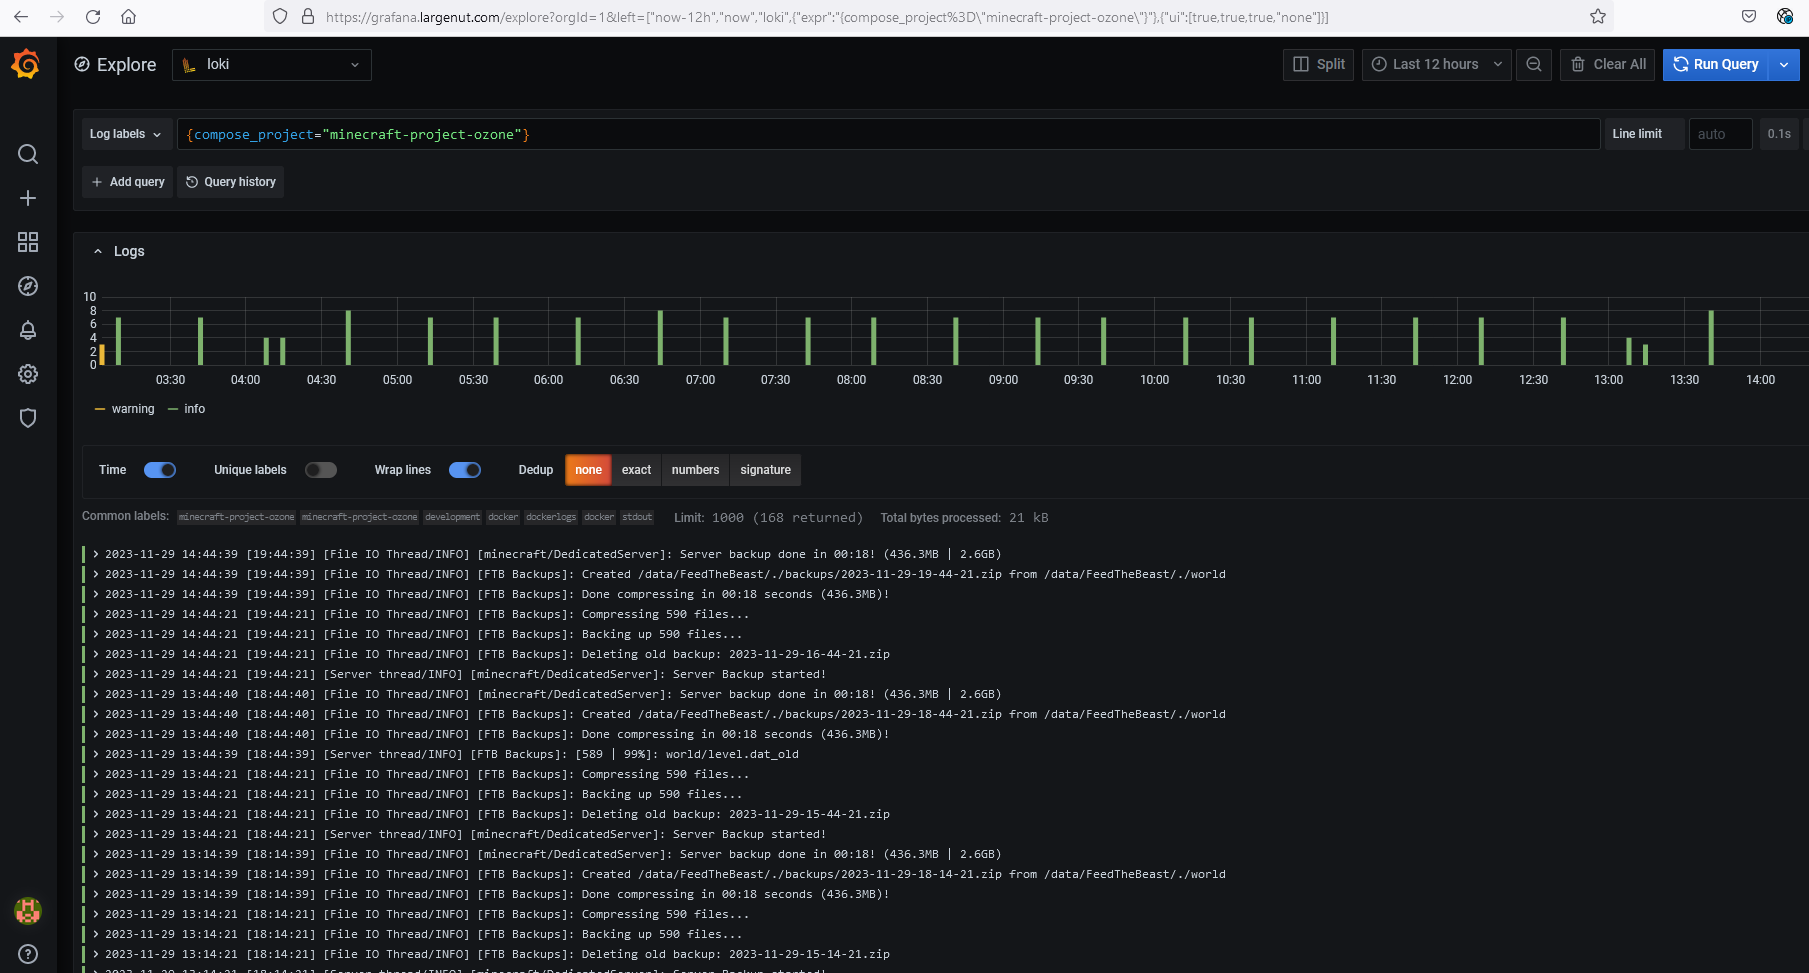
Explore your data
Navigate to Explore > Log labels > Select a label for the container or containers you added logging for.